
St. Louis City and County Drug-involved Death Information
On this page you will find reports on St. Louis City and County overdose mortality based on information received from the Medical Examiner’s office. Reports are ordered from the most recent to the oldest. If you have any additional questions about this information, please reach out to our team at nomodeaths@mimh.edu.
St. Louis City and County Drug-involved Deaths
January-June 2023
*Click on images below for more information and a printable copy of infographic
Summary Points from STL City and County Combined Drug-Involved Deaths Jan-June 2023
(data is still considered preliminary and subject to change)
476 people lost their lives due to a drug-involved death in the first six months of 2023 according to initial data
This is similar to the number of deaths from the first half of 2022
Individuals aged 35-44 experienced the highest number of deaths in 2023
Those aged 25-34 had the largest decrease (26%) in deaths compared to 2022
Those aged 65 and over had the largest increase (43%) in deaths compared to 2022
Types of drugs involved in deaths:
80% of deaths involved an opioid
Fentanyl was involved in 98% of these deaths
Almost half (45%) of all deaths involved stimulants (like methamphetamines)
1 out of 3 deaths included both opioids and stimulants
About 1 out of 5 deaths included xylazine (also known as “tranq”)
Race/sex outcomes
White females experienced an 11% decrease in the number of deaths in 2023 compared to 2022
Black males continue to have the highest number of deaths
The mortality (death) rate decreased among Black and White females in 2023
Black males continue to have the highest mortality rate across all groups


Drug-Involved Death Report: St. Louis City and County, Comparing 2021-2022
For access to the full report please click here
Lives Lost in 2022
We recognize that the deaths highlighted in this report represent individuals who led full lives. They were peoples’ children, parents, siblings, friends, coworkers, and loved ones. We mourn the loss of these members of our St. Louis community. This report includes counts of drug-involved deaths[i] within St. Louis City and County in 2022. Though most deaths were among people who were residents of either the City or the County, many deaths were among non-residents.
Key Takeaway Points:
Across St. Louis City and County, there was a 2% decrease in drug-involved deaths in 2022 compared to 2021.
St. Louis City saw an 8% increase and St. Louis County saw an 11% decrease.
White men and women in the City saw the greatest increase in drug-involved deaths from 2021 to 2022 (+23%), while Black men and women in the County saw the largest decrease compared to 2021 (-19%).
Black men in St. Louis City remain the group most affected by drug-involved deaths by count and population-adjusted rate.
A combination of opioids and stimulants has become the most common contributor to death in 2022.
[i] Drug-involved deaths include opioid and other drug poisonings (i.e., “overdoses”). The medical examiners determined that drugs were present in the decedent’s system at a high enough level to have contributed to their death (for example, a vehicular accident or drowning where opioids were present). This is why this report is titled “Drug-Involved Death Report” as opposed to “Overdose Report.”


St. Louis City and County Stimulant-Involved Deaths 2017-2021 (Opioids and stimulants combined AND stimulants with no opioids present)
Key Takeway Points:
Opioids and Stimulants Combined
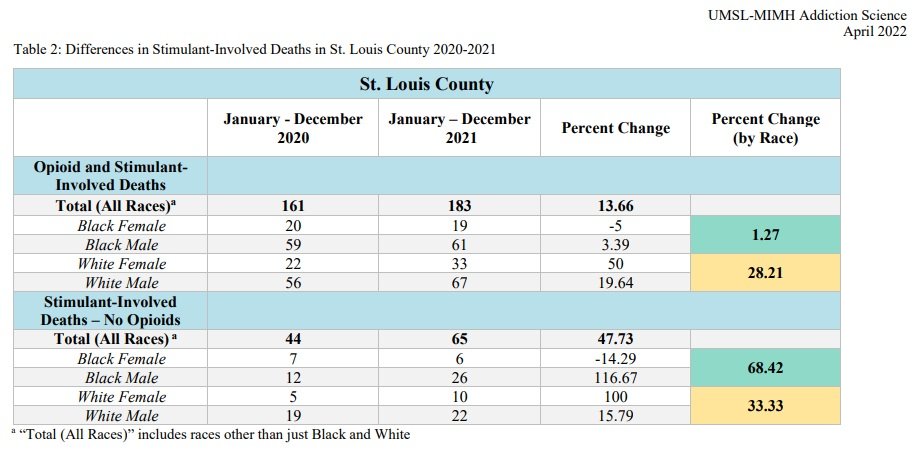
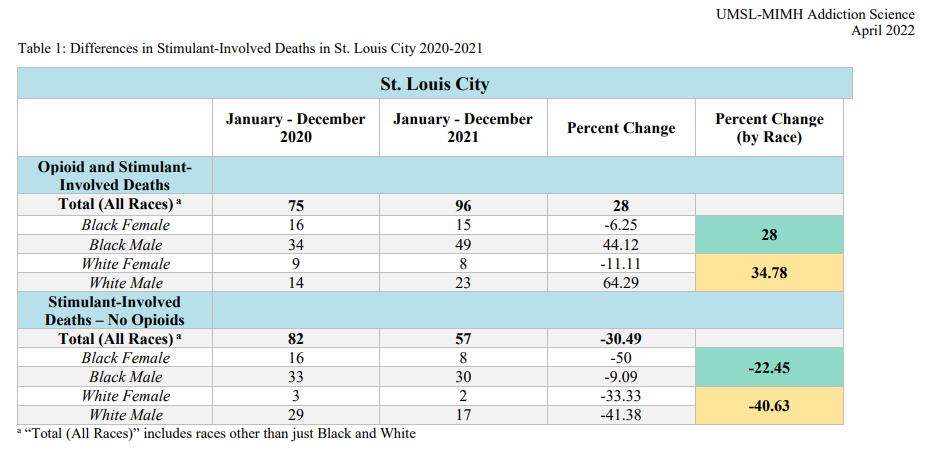
▪ Overall, in St. Louis City and County combined, opioid and stimulant-involved deaths increased by 18% in 2021 compared to 2020.
▪ In St. Louis City, the highest proportional increases were most evident among White males (+65%) followed by Black males (+44%).
▪ In St. Louis County the highest proportional increases were most evident among White females (+50%) followed by White males (+20%).
▪ In 2017, 2018, 2019, 2020, Black males in St. Louis County had the highest rates of opioid and stimulant combined deaths, and in 2021, Black males in St. Louis City had the highest rates.
Stimulants – No Opioids
Overall, in St. Louis City and County combined, stimulant-involved deaths (with no evidence of opioids being present) decreased by 3% in 2021 compared to 2020.
The rate of stimulant-involved deaths decreased in the city but increased in the county in 2021 compared to 2020.
In St. Louis City, the total number of stimulant-involved deaths across all groups decreased by 30% in 2021 compared to 2020.
The largest proportional decreases were most evident among Black females (-50%) followed by White males (-41%).
In St. Louis County, the total number of stimulant-involved deaths across all races increased by 48% in 2021 compared to 2020.
The largest proportional increases were most evident among Black males (+117%) followed by White females (+100%).
From 2017-2021, Black males in St. Louis City had the highest rates of stimulant-involved deaths followed by St. Louis City White males.


Report Produced by UMSL-MIMH Addiction Science Team
Data Source: St. Louis City and County Medical Examiner Office
*Click on images for pdf of full report, charts, and key takeaways
To cite this source: University of Missouri, St. Louis-Missouri Institute of Mental Health Addiction Science Team, St. Louis City and St. Louis County Medical Examiners. (2022). St. Louis City and County Stimulant-Involved Deaths (2017-2021). Retrieved from https://www.mimhaddisci.org/missouri-overdose-data
Preliminary Drug Involved Deaths in St. Louis City and County, comparing 2020-2021
Key Takeway Points:
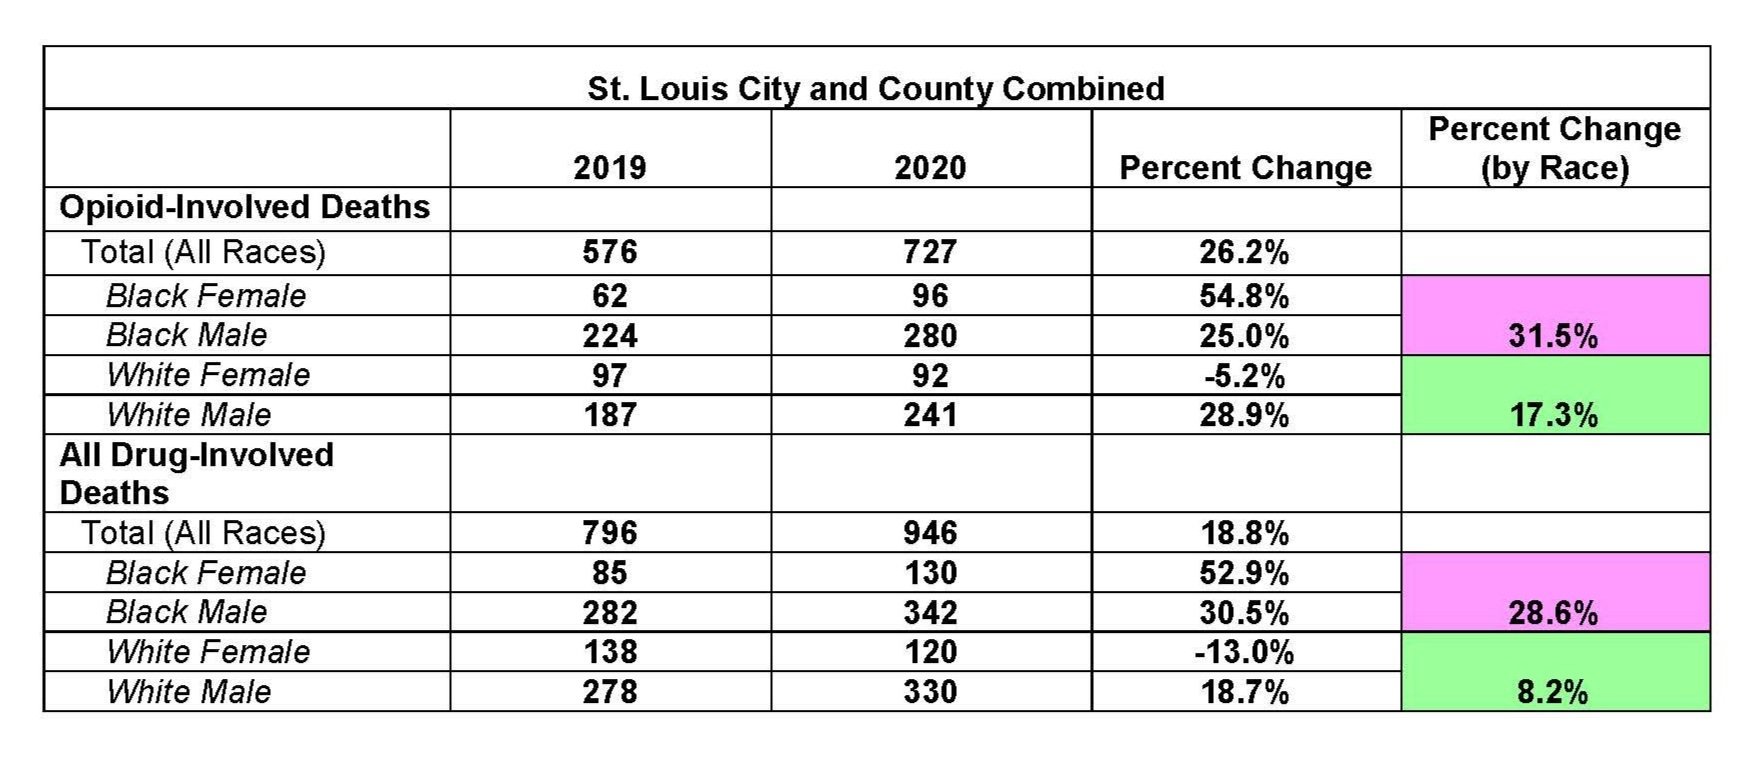
Overall, all drug-involved deaths decreased in St. Louis City (- 9%) but increased in St. Louis County (+8%) in 2021.
Opioid-involved deaths decreased (-2%) in St. Louis City and remained stable in St. Louis County in 2021.
In St. Louis City and County combined, opioid-involved deaths continued to represent the majority (77%) of all drug-involved deaths
In St. Louis City and County combined, deaths among males accounted for 72% of all drug-involved deaths.
St. Louis City total counts and rates of all drug-involved deaths increased from 2019-2020 and then decreased from 2020-2021, though not to pre-pandemic levels.
The greatest proportional decreases of all drug-involved deaths in the City were most evident among White females followed by White males.
In 2019, 2020, and 2021 in St. Louis City, Black males had the highest rates of all-drug involved deaths.
St. Louis County total counts and rates of all drug-involved deaths increased each year from 2019-2021.
In 2019, 2020, and 2021 in St. Louis County, Black males had the highest rates of all drug-involved deaths.
Among Black individuals, all drug-involved deaths increased in both St. Louis City (+2%) and in St. Louis County (+16%).
Among White individuals, all-drug involved deaths decreased in St. Louis City (-22%) yet increased in St. Louis County (+1%).


*Click on images on for pdf of full report, charts, and key takeaways
To cite this source: University of Missouri, St. Louis-Missouri Institute of Mental Health Addiction Science Team, St. Louis City and St. Louis County Medical Examiners. (2022). St. Louis City and County Drug-Involved Deaths Report 2021. (2020-2021). Retrieved from https://www.mimhaddisci.org/missouri-overdose-data
St. Louis City and County Zip Codes with Highest Mortality, Counts and Rates in 2021*
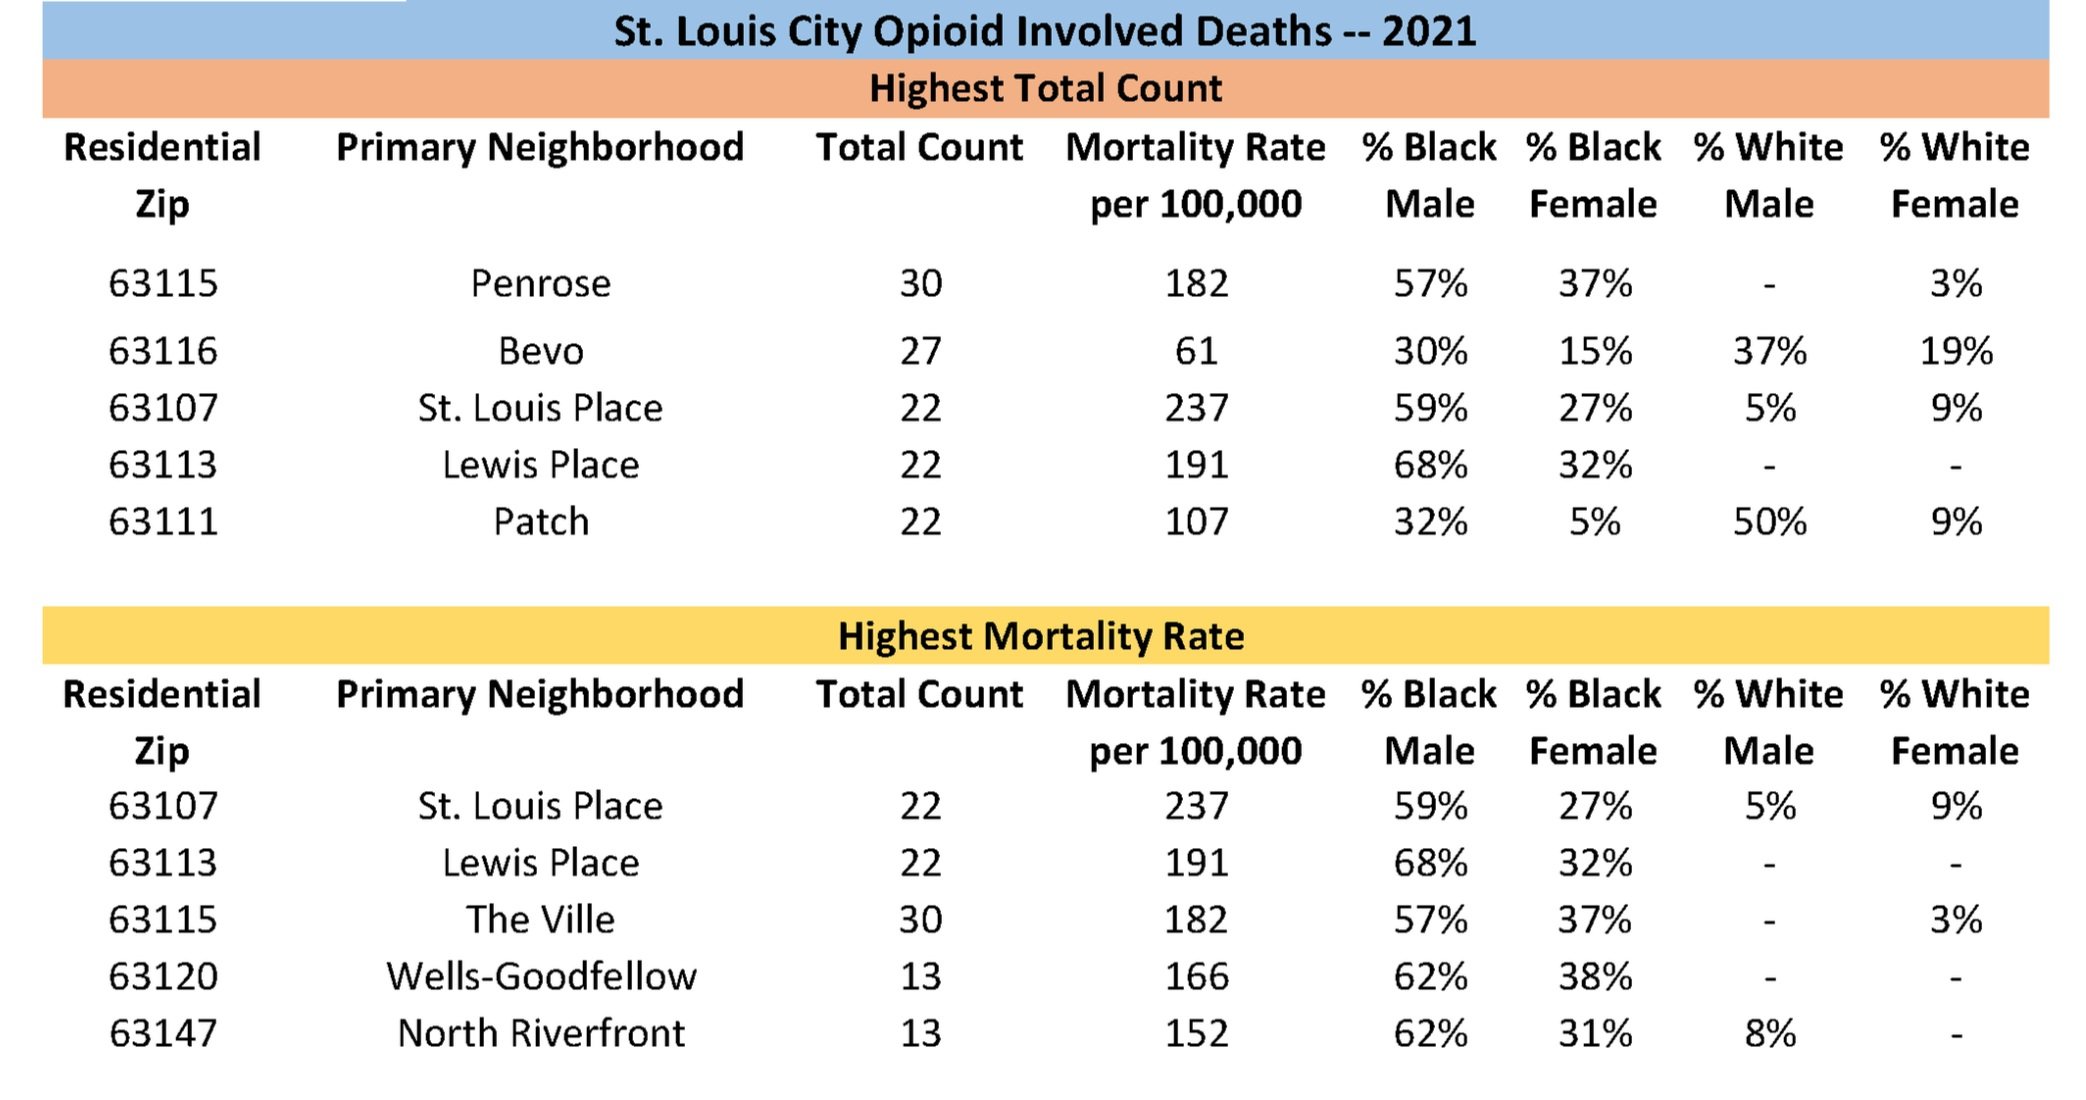

To cite this source: University of Missouri, St. Louis‐Missouri Institute of Mental Health Addiction Science Team, St. Louis City and St. Louis County Medical Examiners. (2022). The American Community Survey. (2016‐2020). STL City/County OD Rates by Top 5 Residential Zip Codes. (2020‐2021). Retrieved https://www.mimhaddisci.org/missouri-overdose-data
*Click on images for pdf of full report and charts

Drug-involved Deaths in St. Louis City and County in 2020: The Roles of Opioids, Stimulants, Race, & Sex
*Click on image for more information and data points; all data is considered preliminary